Web Apps with Raspberry Pi
Having implemented the small project about data analytics with Python, we are now well equipped to do something useful with the data analytics capabilities. In particular, we want to build a small Web app that serves a page where you can decide on a ticker symbol and you get back historical stock price data for that symbol.
The framework we are going to use is called Flask (cf. http://flask.pocoo.org/) and has become quite popular recently in the Python world. Installation in this case is straightforward:
sudo pip install Flask
sudo pip install flask-wtf
To get our Web app to be build served, we need a Web server. A popular choice in the Python world is Tornado (cf. http://www.tornadoweb.org/en/stable/). Install it via:
sudo pip install tornado
This should also be quick and straightforward. This is almost all we need to use the RPi as a Web server for Web sites or applications.
A First Example
Let us see if we can implement the “Hello World!” example of Flask and get it served with Tornado. First the Web app itself:
#
# From http://flask.pocoo.org
#
from flask import Flask
app = Flask(__name__)

@app.route("/")
def hello():
    return "Hello World!"
As you see, a few lines of code suffice for a propor Web application—even if it is only a very small one. The download link for this Python module.
Next, we need to wrap the app into a WSGI container (cf. http://en.wikipedia.org/wiki/Web_Server_Gateway_Interface) to be served by Tornado:
#
# From http://flask.pocoo.org
#
from tornado.wsgi import WSGIContainer
from tornado.httpserver import HTTPServer
from tornado.ioloop import IOLoop
from flask_test import app

http_server = HTTPServer(WSGIContainer(app))
http_server.listen(5000)  # serving on port 5000
IOLoop.instance().start()
Again only a few lines of code. The download link for this script. If you execute this last script via:
python web_serve.py
you should be able to see the result when going to the fixed IP or domain of your RPi in combination with port 5000 (cf. Fixed IP Address):
http://xx.yy.zz.100:5000
or:
http://rpi.mydomain.net:5000
Historical Stock Price Data
This Web application retrieves historical stock price data for a user given ticker symbol and calculates two different trends (moving averages). It then outputs a figure with the data and results as well as a HTML table with the raw data.
Let us start with the Web app code itself:
#
# Historical Stock Prices
# with the RPi using Python & Flask
#
# stock_data.py
#
# (c) Dr. Yves J. Hilpisch
# The Python Quants
#

import pandas as pd
import pandas.io.data as web
import matplotlib.pyplot as plt
from flask import Flask, request, render_template, redirect, url_for
from forms import SymbolSearch


app = Flask(__name__)

@app.route("/", methods=['GET', 'POST'])
def main():
    form = SymbolSearch(csrf_enabled=False)
    if request.method == 'POST' and form.validate():
        return redirect(url_for('results', symbol=request.form['symbol'],
                            trend1=request.form['trend1'],
                            trend2=request.form['trend2']))
    return render_template('selection.html', form=form)

@app.route("/symbol/<symbol>+<trend1>+<trend2>")
def results(symbol, trend1, trend2):
    data = web.DataReader(symbol, data_source='yahoo')
    data['Trend 1'] = pd.rolling_mean(data['Adj Close'], window=int(trend1))
    data['Trend 2'] = pd.rolling_mean(data['Adj Close'], window=int(trend2))
    data[['Adj Close', 'Trend 1', 'Trend 2']].plot()
    output = 'results.png'
    plt.savefig('static/' + output)
    table = data.tail().to_html()
    return render_template('results.html', symbol=symbol,
                            output=output, table=table)


if __name__ == '__main__':
    app.run(debug=True)
The download link for this Python script.
We need a simple WTF form for data input (download link)
#
# Data input form
# forms.py
#

from wtforms import TextField
from wtforms.fields import SubmitField
from wtforms.validators import DataRequired
from flask.ext.wtf import Form

class SymbolSearch(Form):
    symbol = TextField('<b>Symbol</b> (eg AAPL, MSFT)',
                        validators=[DataRequired()])
    trend1 = TextField('<b>Trend 1</b> (eg 20, 42)',
                        validators=[DataRequired()])
    trend2 = TextField('<b>Trend 2</b> (eg 100, 252)',
                        validators=[DataRequired()])
    submit = SubmitField()
The major layout template (download link:
<!-- layout.html -->
<!doctype html>
<title>Historical Stock Prices</title>

<head>

</head>

<link rel=stylesheet type=text/css
      href="{{ url_for('static', filename='style.css') }}">

<link href='http://fonts.googleapis.com/css?family=PT+Sans'
      rel='stylesheet' type='text/css'>

<link rel="shortcut icon"
      href="http://hilpisch.com/favicon.ico">

<div class=page>

  <div class=logo>
    <img src='http://hilpisch.com/tpq_logo.png' alt="TPQ Logo">
  </div>

  <div class=metanav>
    <a href="{{ url_for('main')}}">back to search</a>
  </div>
  {% block body %}

  {% endblock %}
</div>
The sub-template for the data input (download link):
<!-- selection.html -->
{% extends "layout.html" %}

{% macro render_field(field) %}
  <dd>{{ field.label }}
  <dd>{{ field(**kwargs)|safe }}
  {% if field.errors %}
    <ul class=errors>
    {% for error in field.errors %}
      <dd>{{ error }}</dd>
    {% endfor %}
    </ul>
  {% endif %}
  </dd>
{% endmacro %}

{% block body %}

  <div class="form">
  <form action="{{ url_for('main') }}" method=post
   enctype="multipart/form-data">
    <dl>
      <dd><h1>Search for a Ticker Symbol</h1></dd><br>

      <dd>Data will be retrieved from Yahoo! Finance.<br>Make sure to use a valid ticker symbol.</dd><br><br>

      <dd>{{ render_field( form.symbol ) }}</dd><br>
      <dd>{{ render_field( form.trend1 ) }}</dd><br>
      <dd>{{ render_field( form.trend2 ) }}</dd><br>
      <dd>{{ render_field( form.submit ) }}</dd><br>

    </dl>
  </form>
  </div>

{% endblock %}
And the sub-template for the results output (download link):
<!-- results.html -->
{% extends "layout.html" %}

{% block body %}


    <h1>Results for Symbol {{ symbol }}</h1>

    <img width=100% src="{{ url_for('static', filename='results.png') }}">

    <br><br>

    {{ table | safe }}


{% endblock %}
Also, a bit of CSS styling (download link)
/* style.css */
body { font-family: 'PT Sans', sans-serif; background: #eee; }
a, h1, h2 { color: #021A80; }
h1, h2 { font-family: 'PT Sans', sans-serif; margin: 0; text-align: center;}
h1 { font-size: 1.4em; border-bottom: 2px solid #eee; }
h2 { font-size: 1.0em; }

a:link { color: #B40404; text-decoration:none; }
a:visited { color: #B40404; text-decoration:none; }

.dataframe { margin-left: auto; margin-right: auto;}

.page { font-family: 'PT Sans', sans-serif; margin: 2em auto; width: 66em;
                  padding: 0.8em; background: white; color: #021A80}

.metanav { text-align: right; font-size: 1em; padding: 0.3em;
                  margin-bottom: 1em; background: #fafafa; }

.logo img { width: 30%; display: block; margin-right: auto;
            margin-left: auto; }

.errors { font-size: 0.8em; color: red;}

.form {text-align: center;}
Finally, the Tornado WSGI wrapper for the app (download link):
#
# WSGI Wrapper for the
# Historical Stock Data App
#
# run_stock_app.py
#
from tornado.wsgi import WSGIContainer
from tornado.httpserver import HTTPServer
from tornado.ioloop import IOLoop
from stock_data import app

http_server = HTTPServer(WSGIContainer(app))
http_server.listen(8888)  # serving on port 8888
IOLoop.instance().start()
All these files should be placed in the following folder structure:
In [1]: import os

In [2]: for path, dirs, files in os.walk('./source/stock_app'):
   ...:     print path
   ...:     for f in files:
   ...:         print f
   ...:
./source/stock_app
forms.py
forms.pyc
run_stock_app.py
stock_data.py
stock_data.pyc
./source/stock_app/static
results.png
style.css
./source/stock_app/templates
layout.html
results.html
selection.html
When the working directory is stock_app, the following command then runs the Web app:
python run_stock_app.py
You should now be able to access the Web application via (cf. Fixed IP Address):
http://xx.yy.zz.100:8888
or:
http://rpi.mydomain.net:8888
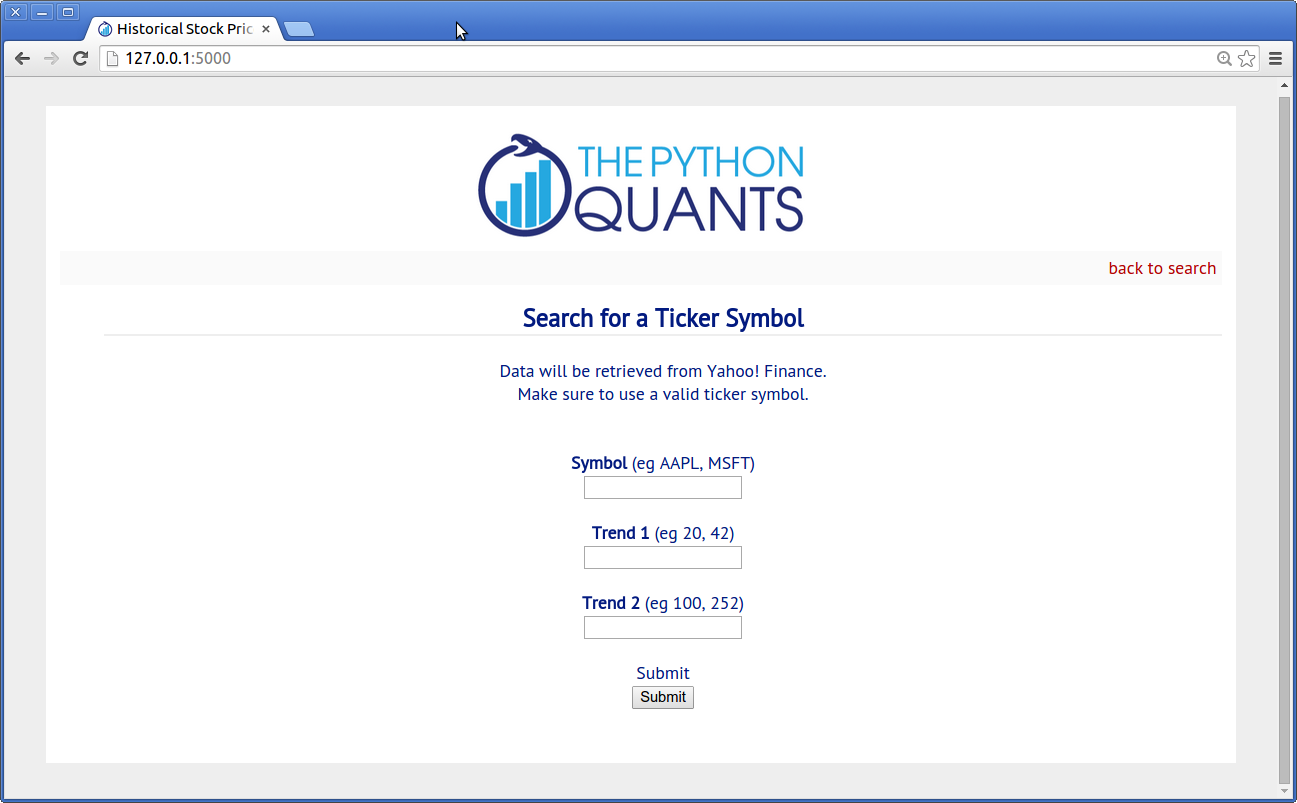
The starting/main page for the data input might then look like (here the app is run locally):
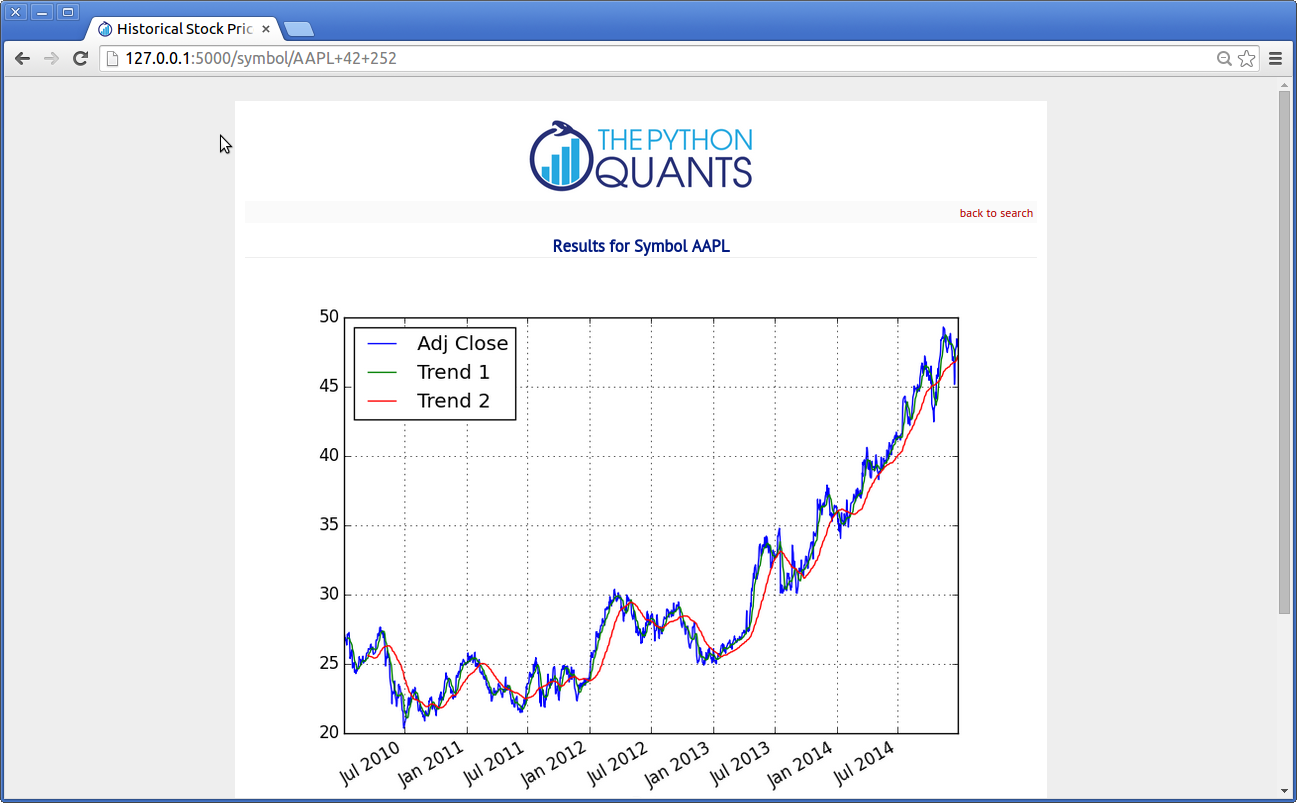
The results output page looks like this:
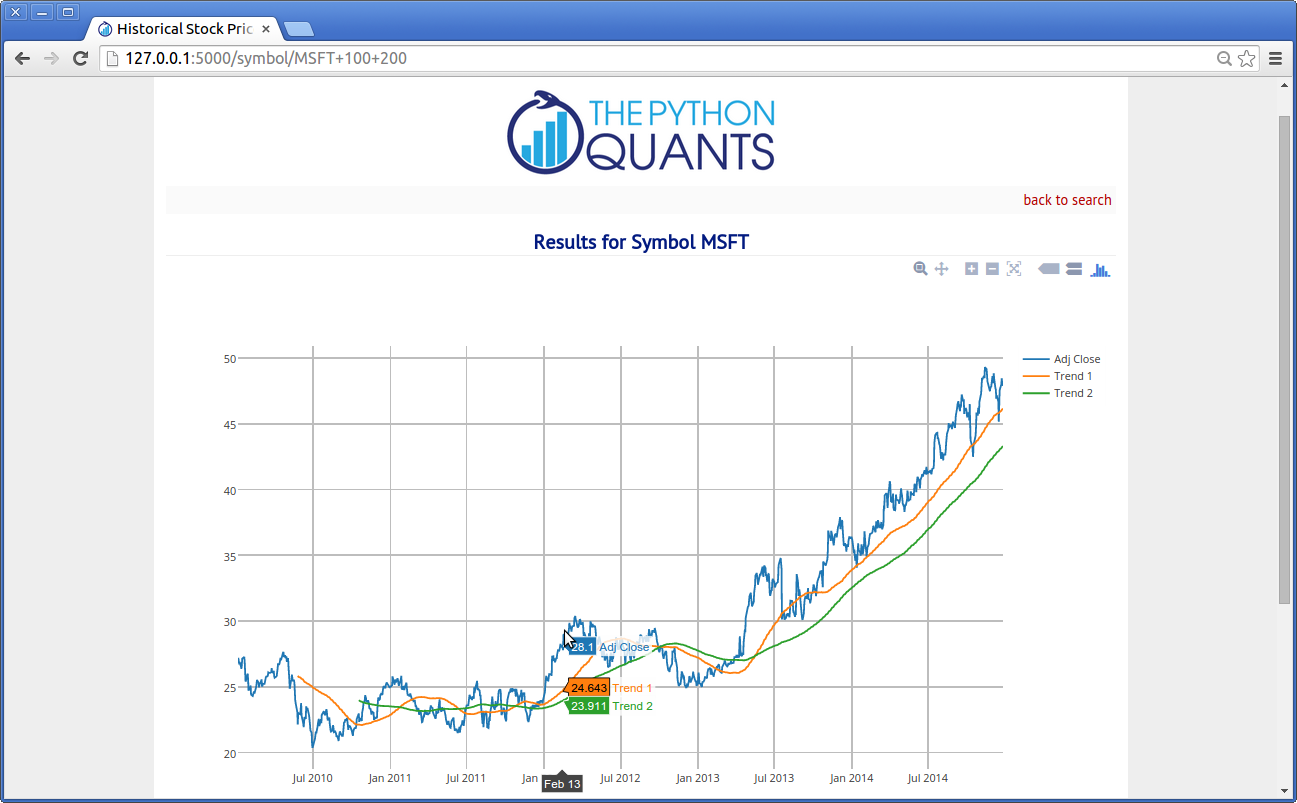
Generating Interactive D3 Plots
Modern Web applications generally rely on nicely rendered, interactive graphics. The following example slightly adjusts the previous one to accomplish exaclty that. The main tool used here is plotly (cf. http://plot.ly), a graphics engine that allows to easily transform static Python/matplotlib plots into interactive D3.js plots (http://d3js.org/) or to directly generate such plots from Python.
You need to install plotly as follows:
sudo pip install plotly
You also need to create an account on the Web site http://plot.ly.
The major changes have be made in the main application module (download link):
#
# Historical Stock Prices
# with the RPi using Python & Flask & Plotly
#
# stock_interactive.py
#
# (c) Dr. Yves J. Hilpisch
# The Python Quants
#

import pandas as pd
import pandas.io.data as web
import matplotlib.pyplot as plt
import plotly.plotly as ply
from plotly.graph_objs import Figure, Layout, XAxis, YAxis
from flask import Flask, request, render_template, redirect, url_for
from forms import SymbolSearch

#
# Needed for plotly usage
#

ply.sign_in('yves', 'token')

def df_to_plotly(df):
    '''
    Converting a pandas DataFrame to plotly compatible format.
    '''
    if df.index.__class__.__name__=="DatetimeIndex":
        x = df.index.format()
    else:
        x = df.index.values
    lines = {}
    for key in df:
        lines[key] = {}
        lines[key]['x'] = x
        lines[key]['y'] = df[key].values
        lines[key]['name'] = key
    lines_plotly = [lines[key] for key in df]
    return lines_plotly

#
# Main app
#

app = Flask(__name__)

@app.route("/", methods=['GET', 'POST'])
def main():
    form = SymbolSearch(csrf_enabled=False)
    if request.method == 'POST' and form.validate():
        return redirect(url_for('results', symbol=request.form['symbol'],
                            trend1=request.form['trend1'],
                            trend2=request.form['trend2']))
    return render_template('selection.html', form=form)

@app.route("/symbol/<symbol>+<trend1>+<trend2>")
def results(symbol, trend1, trend2):
    data = web.DataReader(symbol, data_source='yahoo')
    data['Trend 1'] = pd.rolling_mean(data['Adj Close'], window=int(trend1))
    data['Trend 2'] = pd.rolling_mean(data['Adj Close'], window=int(trend2))
    layout = Layout(
        xaxis=XAxis(showgrid=True, gridcolor='#bdbdbd', gridwidth=2),
        yaxis=YAxis(showgrid=True, gridcolor='#bdbdbd', gridwidth=2)
    )
    fig = Figure(data=df_to_plotly(data[['Adj Close', 'Trend 1', 'Trend 2']]),
                layout=layout)
    plot = ply.plot(fig, auto_open=False)
    table = data.tail().to_html()
    return render_template('plotly.html', symbol=symbol,
                            plot=plot, table=table)


if __name__ == '__main__':
    app.run(debug=True)
We also need to adjust the results output template file (download link):
<!-- plotly.html -->
{% extends "layout.html" %}

{% block body %}


    <h1>Results for Symbol {{ symbol }}</h1>

    <iframe

    width=100% height="650" frameborder="0" seamless="seamless" scrolling="no"

    src="{{ plot }}.embed?width=100%&height=650">

    </iframe>

    <br><br>

    {{ table | safe }}


{% endblock %}
Also, the WSGI wrapping is to be adjusted slightly (download link):
#
# WSGI Wrapper for the
# Historical Stock Data App (Interactive)
#
# run_stock_int.py
#
from tornado.wsgi import WSGIContainer
from tornado.httpserver import HTTPServer
from tornado.ioloop import IOLoop
from stock_interactive import app

http_server = HTTPServer(WSGIContainer(app))
http_server.listen(8888)  # serving on port 8888
IOLoop.instance().start()
Everything else remains the same. Your folder structure should now look like follows:
In [3]: for path, dirs, files in os.walk('./source/stock_int'):
   ...:     print path
   ...:     for f in files:
   ...:         print f
   ...:
./source/stock_int
forms.py
forms.pyc
run_stock_int.py
stock_interactive.py
./source/stock_int/static
style.css
./source/stock_int/templates
layout.html
plotly.html
selection.html
If everything runs as desired, the results page of the interactive version should look like below (here the app runs locally):